Hate crimes are often overlooked, under-reported, or buried in complex reports, making it difficult to grasp the full extent of the problem.
Hate Crimes Map is an open-source project designed to change that.
By leveraging open data on racism and discrimination, this interactive map provides a clear, accessible visualization of hate crimes reported worldwide.
With this article, I want to tell you the story of this small project. What motivated me to create it, where I gather the data from, and the different steps of the creation process.
If you're a developer (or simply curious) and interested in this topic, I invite you to read on!
Table of Contents
- Why This Project
- The Technology Behind Hate Crimes Map
- Step 1 — Displaying the Map
- Step 2 — Fetching and Transforming the Data
- Step 3 — Displaying Markers for Hate Crimes
- Step 4 — Displaying a Modal on Marker Click by Country
- Step 5 — Responsiveness: Using Cursor for Fast UI Adjustments
- Step 6 — Adding a Color Gradient and Legend
- Step 7 — Adding Filters for Bias Motivation
- Conclusion
Why This Project?
Hate crimes are not just numbers — they represent real victims, real communities suffering from racism, xenophobia, and prejudice.
Using data from the OSCE Hate Crime Database, Hate Crimes Map transforms this raw information into a dynamic, interactive tool that allows users to:
- Explore the geographical distribution of hate crimes worldwide.
- Analyze trends based on year, type of attack, and reporting organizations.
- Promote accountability and awareness by making this information easily accessible.
Behind every data point displayed on this map, there is a human story — always tragic, often ignored.
Hate crimes happen daily, yet societies continue to look away, normalize discrimination, and minimize racism in politics, media, and everyday interactions.
This is a global issue, and today, it's more urgent than ever.
The Technology Behind Hate Crimes Map
To build this project, I used Next.js and Tailwind CSS for the frontend, ensuring a fast and responsive experience.
For data visualization, I chose Recharts, a library that integrates seamlessly with React components.
This project was also an opportunity to test Cursor, an AI-powered IDE that completely transformed my workflow.
Thanks to this tool, I developed most of the features in less than a week — something that would have taken me several weeks otherwise, especially when refining the responsive design.
Hate Crimes Map is open-source and available on GitHub.
Step 1 — Displaying the Map
I started by setting up a Next.js project with TypeScript using create-next-app and installed the necessary dependencies:
1npm install mapbox-gl react-map-gl axios recharts
For the map itself, I used react-map-gl, a React wrapper around Mapbox GL JS, with a public Mapbox token (generate yours here).
The goal was to create a component that initializes the map with default settings like position, zoom level, and style.
A basic version of the component looks like this:
1import React from 'react';2import MapGL from 'react-map-gl';34const Map = () => {5 const [viewport, setViewport] = React.useState({6 latitude: 20,7 longitude: 0,8 zoom: 2,9 width: '100%',10 height: '500px',11 });12 return (13 <MapGL14 {...viewport}15 onViewportChange={(nextViewport) => setViewport(nextViewport)}16 mapboxAccessToken={process.env.NEXT_PUBLIC_MAPBOX_TOKEN}17 mapStyle="mapbox://styles/mapbox/streets-v11"18 />19 );20};21export default Map;
With just a few lines of code, I had a fully interactive map displaying the world, ready to be enriched with real data.
Step 2 — Fetching and Transforming the Data
With the map in place, the next step was integrating real-world hate crime data.
I sourced the information from the OSCE Hate Crime Report (available here).
The Organization for Security and Co-operation in Europe (OSCE) has collected nearly 30,000 reported hate crimes across 41 participating countries from official government sources and civil society groups.
However, the data was provided in Excel (.xlsx) format, which wasn't suitable for direct use in the project.
To work with it programmatically, I converted it to JSON, allowing me to manipulate and display it dynamically on the map.
You can find the JSON file here.
Step 3 — Displaying Markers for Hate Crimes
Once the data was cleaned and imported, the next challenge was grouping the hate crimes by country.
Using JavaScript's .reduce(), I structured the dataset into an easily accessible format:
1const crimesByCountry = data.reduce(2 (acc, crime) => {3 const country = crime.Country;4 if (!acc[country]) {5 acc[country] = [];6 }7 acc[country].push(crime);8 return acc;9 },10 {} as Record<string, ICrime[]>11);
At this stage, I had a structured dataset containing all reported hate crimes, categorized by country.
Next, I needed a way to place markers on the map at the correct geographical locations.
To do this, I created an object mapping country names to their respective latitude and longitude. You can see the full dataset of country coordinates here.
By matching the country name from the crime dataset with the corresponding coordinates, I generated a FeatureCollection for the map:
1const circleData = {2 type: 'FeatureCollection',3 features: Object.entries(crimesByCountry)4 .filter(([country]) => countryCoordinates[country])5 .map(([country, crimes]) => ({6 type: 'Feature',7 properties: {8 count: crimes.length,9 country,10 },11 geometry: {12 type: 'Point',13 coordinates: countryCoordinates[country],14 },15 })),16};
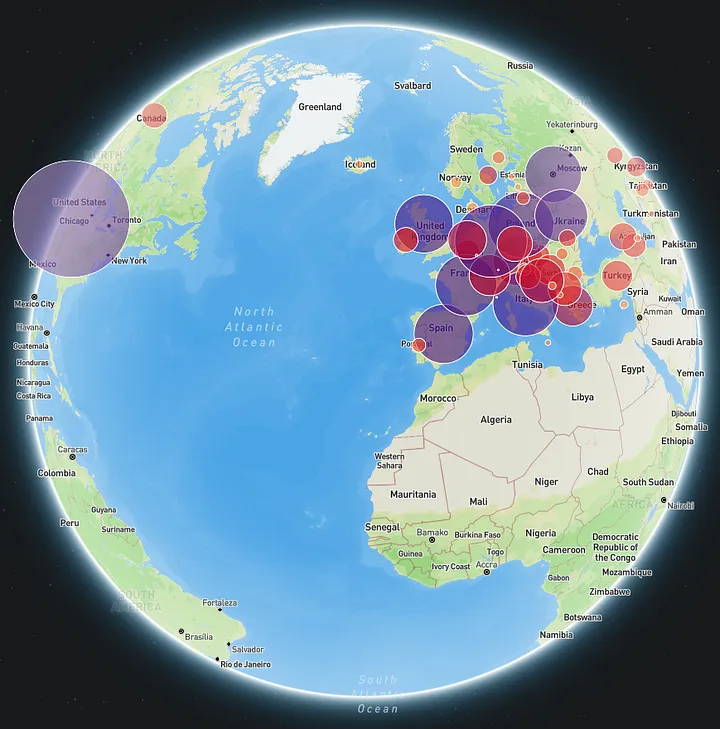
Now, the map displays markers for each country where hate crimes have been reported.
To further enhance readability, I varied the size of the markers based on the number of reports.
At this stage, Hate Crimes Map was starting to take shape — a functional, interactive visualization bringing real data on racism and discrimination to light.
Step 4 — Displaying a Modal on Marker Click by Country
At this point, we had a functional map with markers representing hate crime data, but I wanted to go a step further.
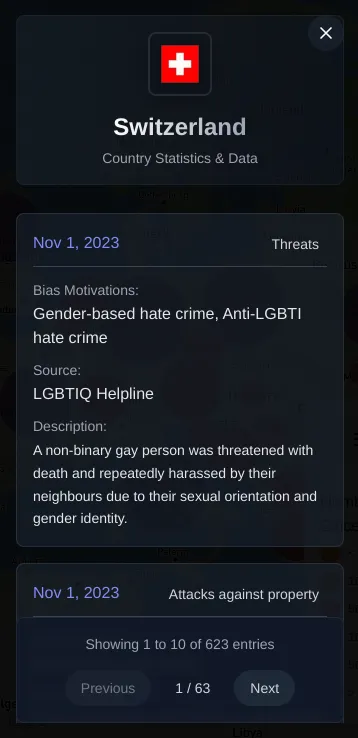
I wanted users to be able to click on a marker to view more detailed information about the reported crimes in that country. This is where I introduced a modal that opens when a marker is clicked.
I managed this by using React's state management to handle the visibility of the modal and trigger the display of a new component: CountryModal.tsx.
To display the country flag, I used the i18n-iso-countries npm package. This package allowed me to retrieve the ISO 3166–1 alpha-2 code of a country dynamically based on its name:
1const countryCode = countries.getAlpha2Code(country, 'en') || '';
With the country code in hand, I used the flagsapi.com service to dynamically generate the URL for the flag image:
1<Image2 src={`https://flagsapi.com/${countryCode}/flat/64.png`}3 alt={`Flag of ${country}`}4 width={80}5 height={80}6 className='w-full h-full object-cover'7/>

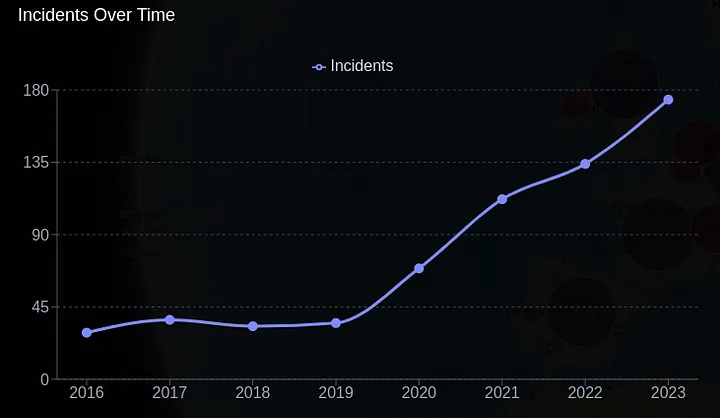
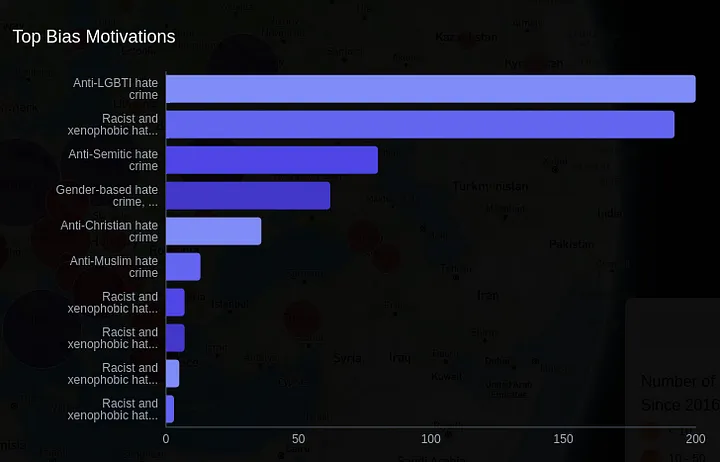
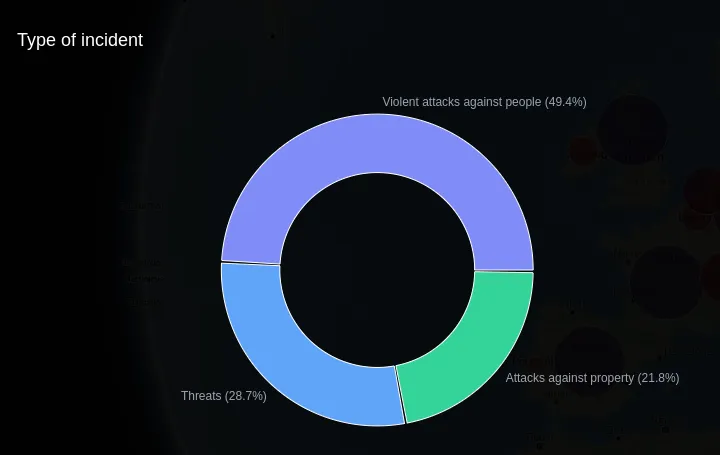
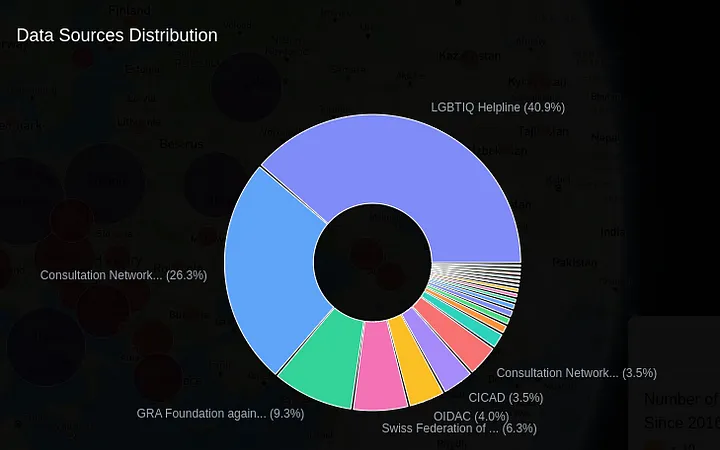
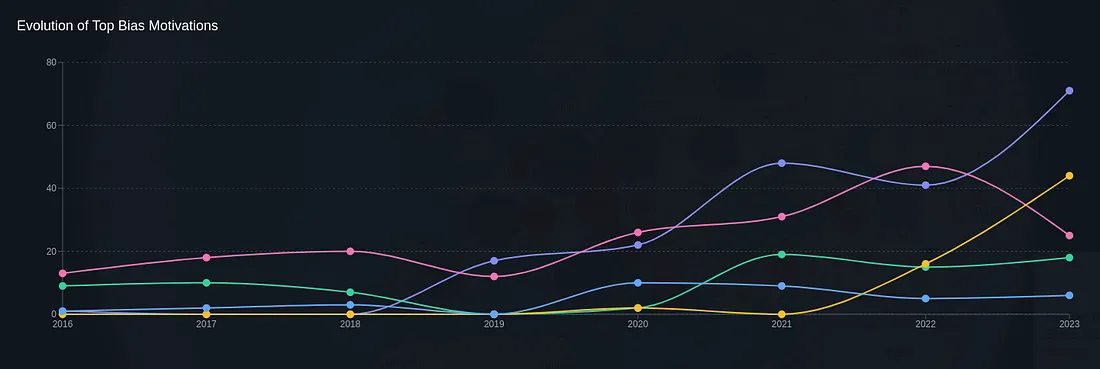
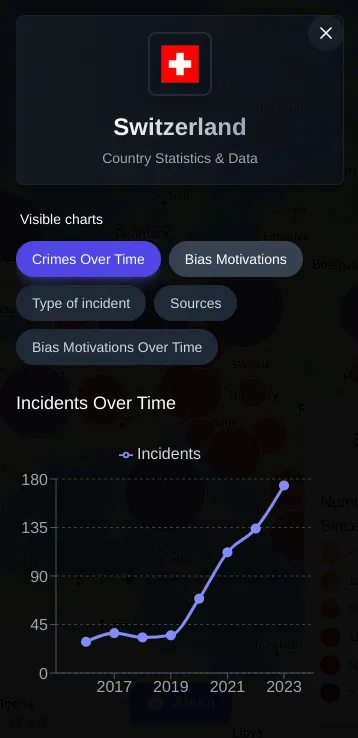
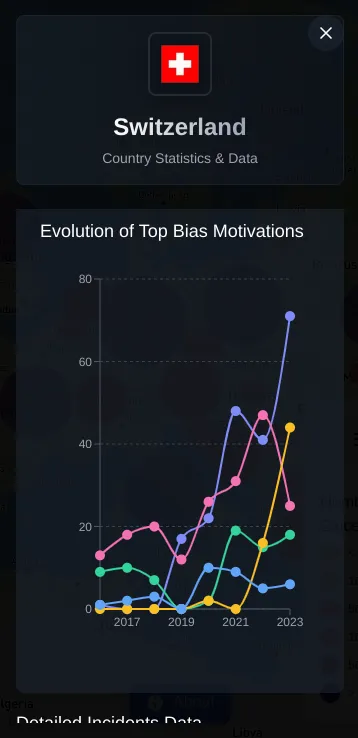
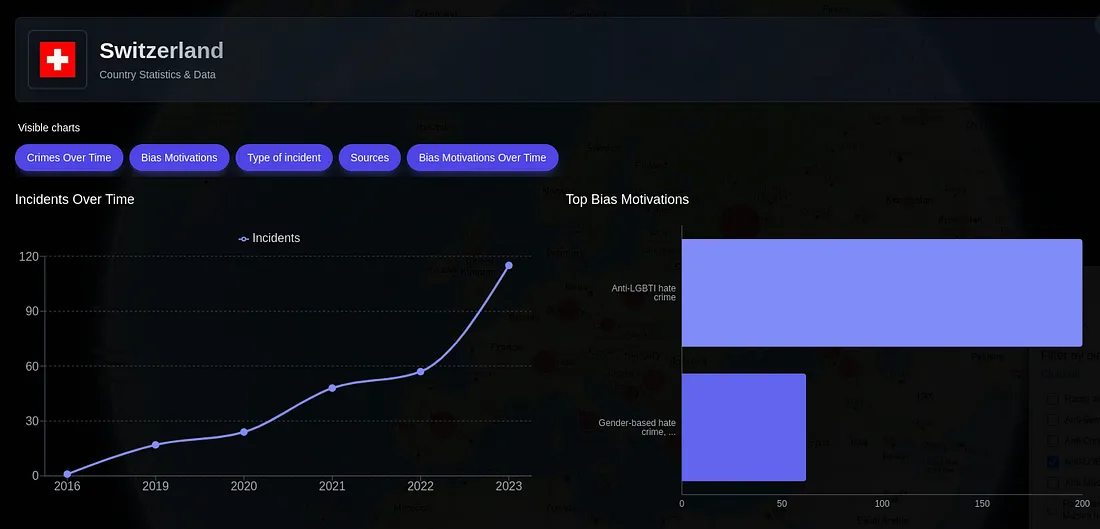
But the real magic happened when I added charts to the modal. I wanted to display several important visualizations based on the data:
- Crime trends over the years (since 2016)
- Bias Motivation distribution
- Type of Incident distribution (attacks against people, property damage, or threats)
- Source distribution (the organizations providing the data)
- Bias Motivation evolution over time. For instance, it revealed that in Switzerland, gender-based and sexual orientation-related hate crimes increased the most in the past two years.
For the charts, I chose to use Recharts, an excellent npm library for rendering data visualizations. It integrated seamlessly into the project and allowed me to display the data in an intuitive and user-friendly manner.
Additionally, beneath the charts, I included a simple table that listed all the data points in detail.

The table allows users to paginate through the data and sort by different columns for better analysis.
Step 5 — Responsiveness: Using Cursor for Fast UI Adjustments
At this stage, I was pretty satisfied with the project, but one thing bothered me: the map and modals were not responsive.
Since most users would likely access the project on their mobile devices, this was a critical issue I needed to address.
Now, CSS and responsive design were never my strong suit, and I didn't want to spend hours tweaking the layout. That's when I decided to leverage Cursor, a tool that truly showed its power in this instance.

I used Cursor's chat feature, where I uploaded the code files I wanted to optimize (12 files in total).
Then, I provided the following prompt to guide Cursor's work:
1The features are all set up and functional. Now comes the most important step.2I want you to rework the UX and layout of this modal. The key points for me are:3- Ease of use across ALL formats (it needs to be 100% responsive and work4well on Desktop, Tablet, and Smartphone)5- Readability of the data6- No loss of information due to cropping or anything like that7- Modern UI design89Feel free to go into the components and make any necessary changes.1011If it's too much for a single iteration, we can do it step by step12to ensure quality work.
Cursor then worked its magic, iterating through the code and asking for my approval after each step.
After just 10 minutes, the result was almost perfect.
I only needed to request a couple of small adjustments:
1Great work! Two things on mobile:2- The modal should take up the whole page for better readability3- The "Incident Type" chart is not centered and is partly cut off45One thing on desktop:6- The modal should be slightly wider for better readability
I was absolutely blown away by how fast and efficient the process was.
A task that would have normally taken me days to complete was wrapped up in minutes.
The responsive design now looked perfect on all devices, providing a seamless experience for users regardless of their screen size.
Step 6 — Adding a Color Gradient and Legend
By this point, the Hate Crimes Map was beginning to take shape, but something was still missing.
While navigating through the r/DataIsBeautiful subreddit (my Sunday hobby), I came across a similar project — a map with markers displaying data.
A Reddit user made a valid point: the map lacked clarity because all the markers were the same color.
I quickly realized the same issue was present on my own map.
The markers didn't stand out enough, which could make it harder for users to quickly interpret the data.
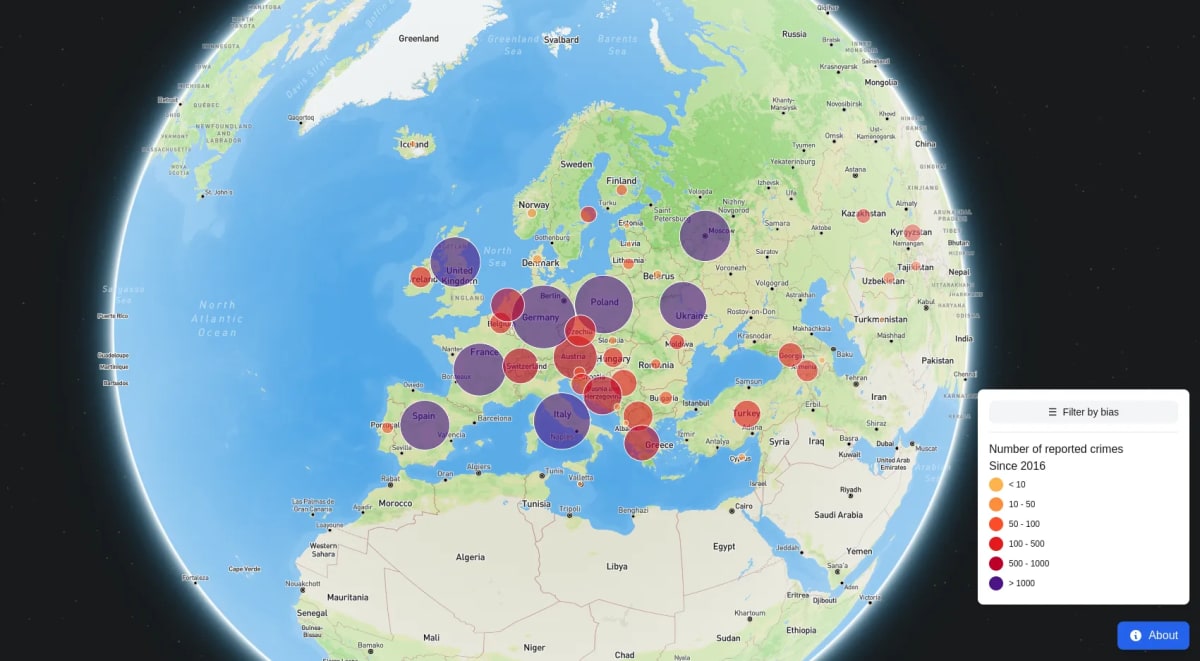
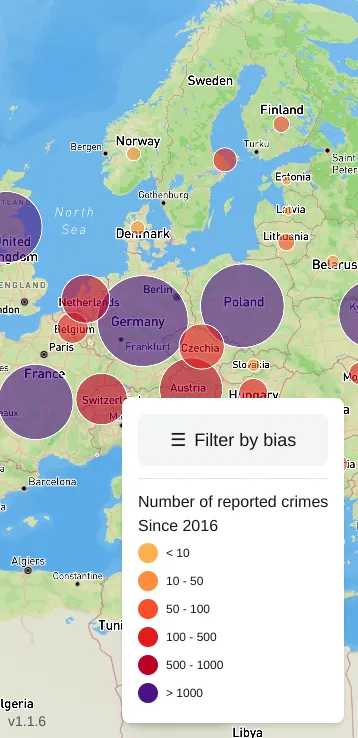
To solve this, I decided to introduce color differentiation based on crime frequency. By grouping the markers into thresholds based on their count, I was able to create a color gradient to represent different levels of crime numbers.
Here's how I defined the thresholds and corresponding colors:
1const thresholds = [10, 50, 100, 500, 1000, 5000];2const colors = [3 '#FEB24C', // light orange4 '#FD8D3C', // orange5 '#FC4E2A', // orange-red6 '#E31A1C', // red7 '#BD0026', // dark red8 '#4A1486', // dark purple9];
And in my map rendering code, I applied the color gradient using Mapbox GL's Layer component:
1<Layer2 id='circles'3 type='circle'4 paint={{5 'circle-radius': ['*', ['sqrt', ['get', 'count']], 1],6 'circle-color': [7 'step',8 ['get', 'count'],9 colors[0],10 thresholds[0],11 colors[1],12 thresholds[1],13 colors[2],14 thresholds[2],15 colors[3],16 thresholds[3],17 colors[4],18 thresholds[4],19 colors[5],20 ],21 'circle-opacity': 0.6,22 'circle-stroke-width': 1,23 'circle-stroke-color': '#FFFFFF',24 }}25/>
It was a simple addition, but it greatly enhanced the visual clarity of the map.
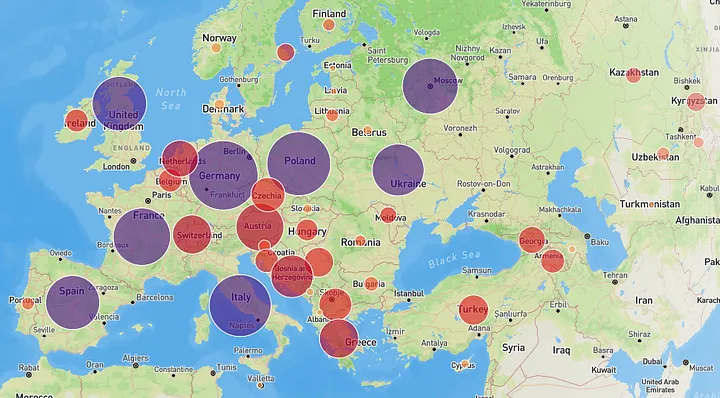
After that, I created a Legend component (Legend.tsx) to display the color gradient and thresholds, helping users understand the data at a glance.
You can check out the full component code here: Legend Component on GitHub.
Once again, Cursor came to the rescue. It helped me make the legend responsive, ensuring it looked great on both desktop and mobile.
Feel free to open the site on mobile to see how smooth the responsive design is: Hate Crimes Map.
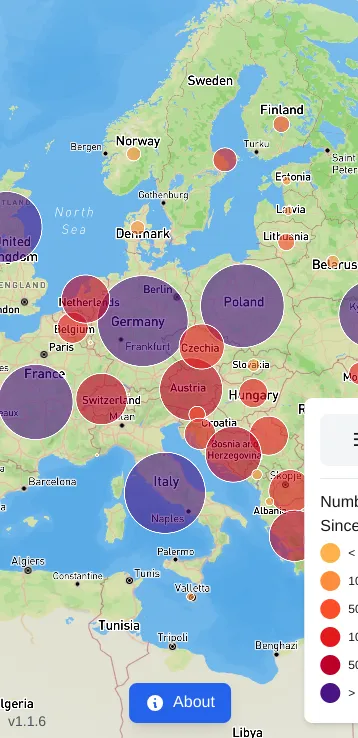
On mobile, the legend appears when you tap on it, and disappears when you tap anywhere outside of it, providing a smooth and intuitive UX.
Step 7 — Adding Filters for Bias Motivation
The next feature I felt was essential before sharing the project was the ability to filter the data by Bias Motivation.
This allows users to focus on specific types of hate crimes, such as those motivated by race, gender, or sexual orientation.
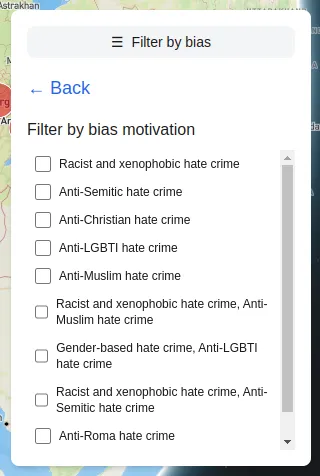
To implement this, I added filters within the Legend component. I introduced a selectedBiases state in my Map.tsx component, which kept track of the user's selected filters.
Based on this state, I filtered the crime data before grouping it by country:
1const crimesByCountry = useMemo(() => {2 return crimes3 .filter((crime) => selectedBiases.length === 0 || selectedBiases.includes(crime['Bias motivations']))4 .reduce(5 (acc, crime) => {6 const country = crime.Country;7 if (!acc[country]) {8 acc[country] = [];9 }10 acc[country].push(crime);11 return acc;12 },13 {} as Record<string, ICrime[]>14 );15}, [crimes, selectedBiases]);
This allows users to interact with the data more deeply, offering a more personalized experience as they can focus on specific bias motivations.
For example, for these filters :
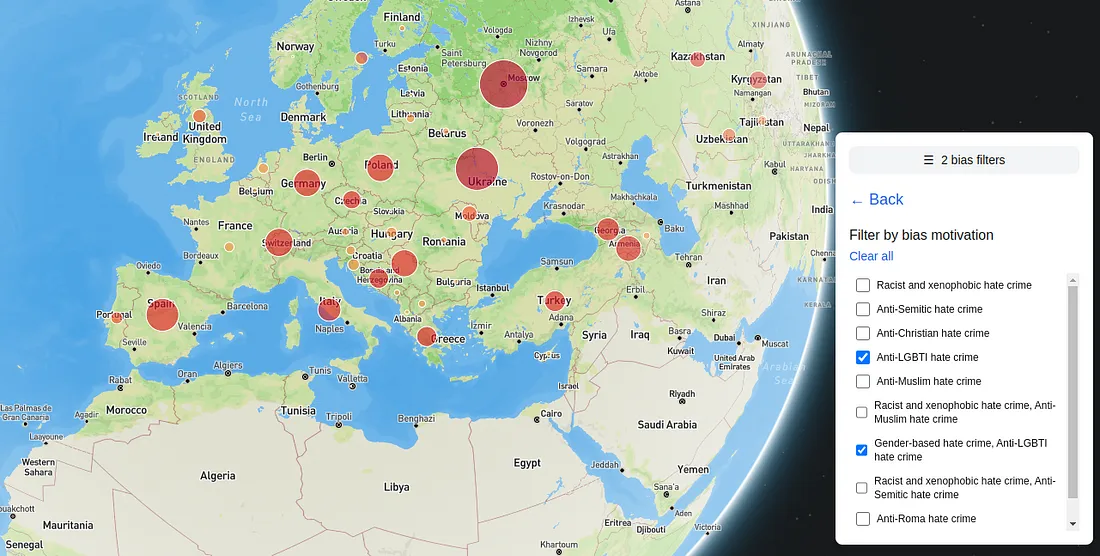
We can clearly see the trend over the past 2 years in Switzerland :
Conclusion
To wrap up this (very) long article, I want to emphasize that I hope this project continues to exist and evolve. That's why I made the decision to open-source it.
I want this project to be used, forked, deployed, and seen by as many people as possible.
Hate crimes should never be accepted or overlooked in society. Unfortunately, these crimes are often invisible or normalized. In a world that's increasingly becoming polarized, it's more important than ever to have projects like this that bring attention to the fact that real people are suffering from this injustice every day.
So, in conclusion:
The Hate Crimes Map is fully open-source, and contributions are welcome!
If you're a developer passionate about data visualization or social justice, take a moment to explore the GitHub repository:
How to Contribute
- Fork the repository.
- Check the CONTRIBUTING.md for contribution guidelines.
- Submit a pull request with your improvements.
Whether you're a researcher, activist, or simply curious, this project invites you to explore, learn, and contribute.
Sources
https://www.hatecrimesmap.org/
https://hatecrime.osce.org/hate-crime-data
https://nextjs.org/
https://tailwindcss.com/
https://recharts.org/en-US/
https://www.cursor.com/
https://github.com/kOaDT/hate-crimes-map
https://visgl.github.io/react-map-gl/
https://console.mapbox.com/account/access-tokens/
https://www.google.com/search?q=xlsx+to+json
https://raw.githubusercontent.com/kOaDT/hate-crimes-map/refs/heads/develop/public/data/hcrw_incidents_all-report.json
https://raw.githubusercontent.com/kOaDT/hate-crimes-map/refs/heads/develop/src/app/utils/countryCoordinates.ts
https://www.npmjs.com/package/i18n-iso-countries
https://en.wikipedia.org/wiki/ISO_3166-1_alpha-2
https://flagsapi.com/
https://www.npmjs.com/package/recharts
https://www.reddit.com/r/dataisbeautiful/
https://raw.githubusercontent.com/kOaDT/hate-crimes-map/refs/heads/develop/src/app/components/Legend.tsx
https://raw.githubusercontent.com/kOaDT/hate-crimes-map/refs/heads/develop/CONTRIBUTING.md